Utility Data

Our pre-generation energy use average was 840kWh/month, which is about 1/4 that of a similar size house in our climate. At our utility rates the cost averaged about $80/month ($20 base + $60 energy use). After installing solar panels in 2012 and making more efficiency improvements, our net use from the grid has dropped to <150 kWh/month. Our annual water use has averaged about 2,100 gallons/month, which is about 1/6th the typical local usage. See the real-time energy use and a detailed summary of annual energy use. The payback was one month - see the payback info.
*NEW* 2023 Annual Utility Use Report *NEW*

Utility Savings

This shows our home energy use compared to a typical local conventionally built home. Efficiency measures reduced our energy needs dramatically. Then efficient utility systems further reduced our consumption. This allowed us to install a relatively small solar array to provide most of the energy we use.

Our site energy Energy Use Intensity (EUI) is 7.7 KBTU/sf/year vs. a Texas average of 41.5. We produce our own energy equivalent to 6.0 KBTU/sf/year, which means we are only drawing 1.7 KBTU/sf/year from the grid. This performance exceeds the rigorous Passive House standard. Efficient design means our house needs 80% less energy than a typical TX house. Click the graphic for a larger view. 
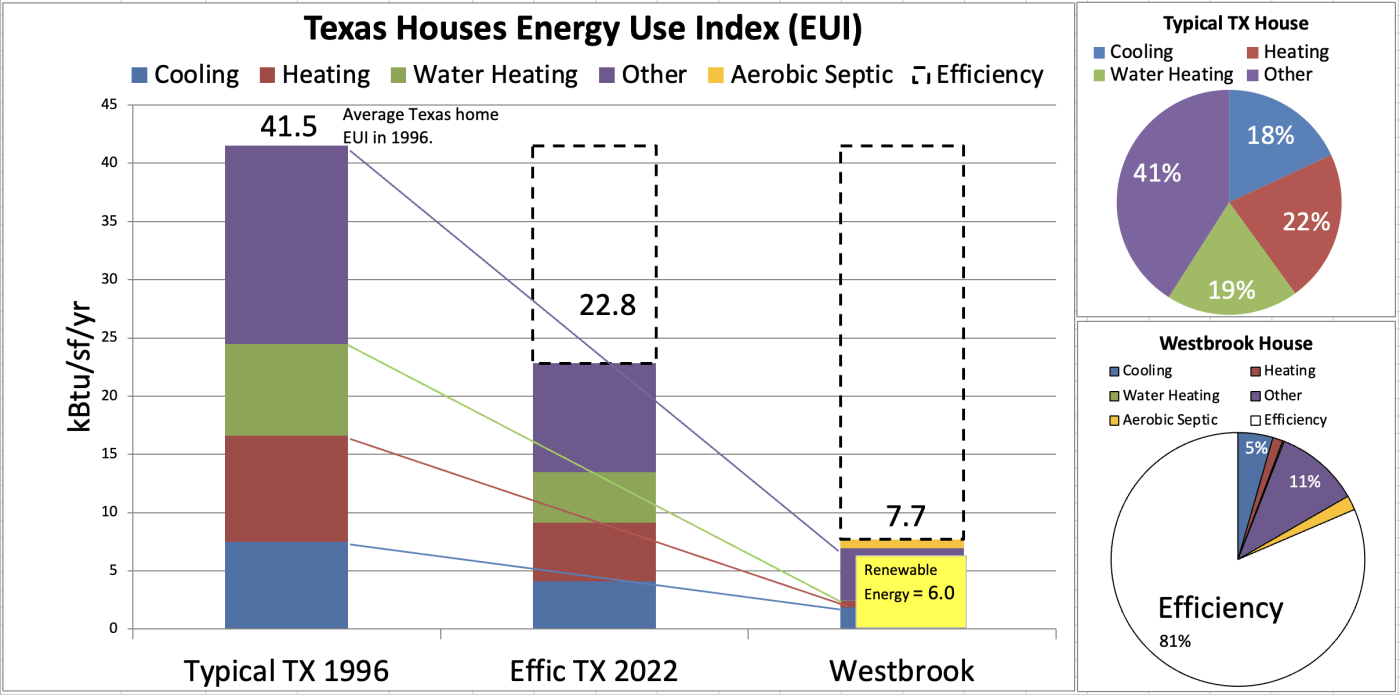
House Efficiency KBTU/sf/year

Utility Costs

Here is the actual data from over 20 years of energy and water use. For the first decade our low use was due to energy efficient design and solar water heating. In 2006 we added a Skystream wind turbine, but the performance was severely limited by trees that were too close and disturbed the wind flow. We sold the turbine in early 2014. The solar PV was installed in late 2012 has produced the majority of our energy needs. Note that our utility base cost is about $24/month, so the  cost for actual energy consumption is much lower. Our energy and water costs are very low.  In 2021 we pad $0 for energy cost all year - we only paid the base fee. Click the graphic for a larger view.
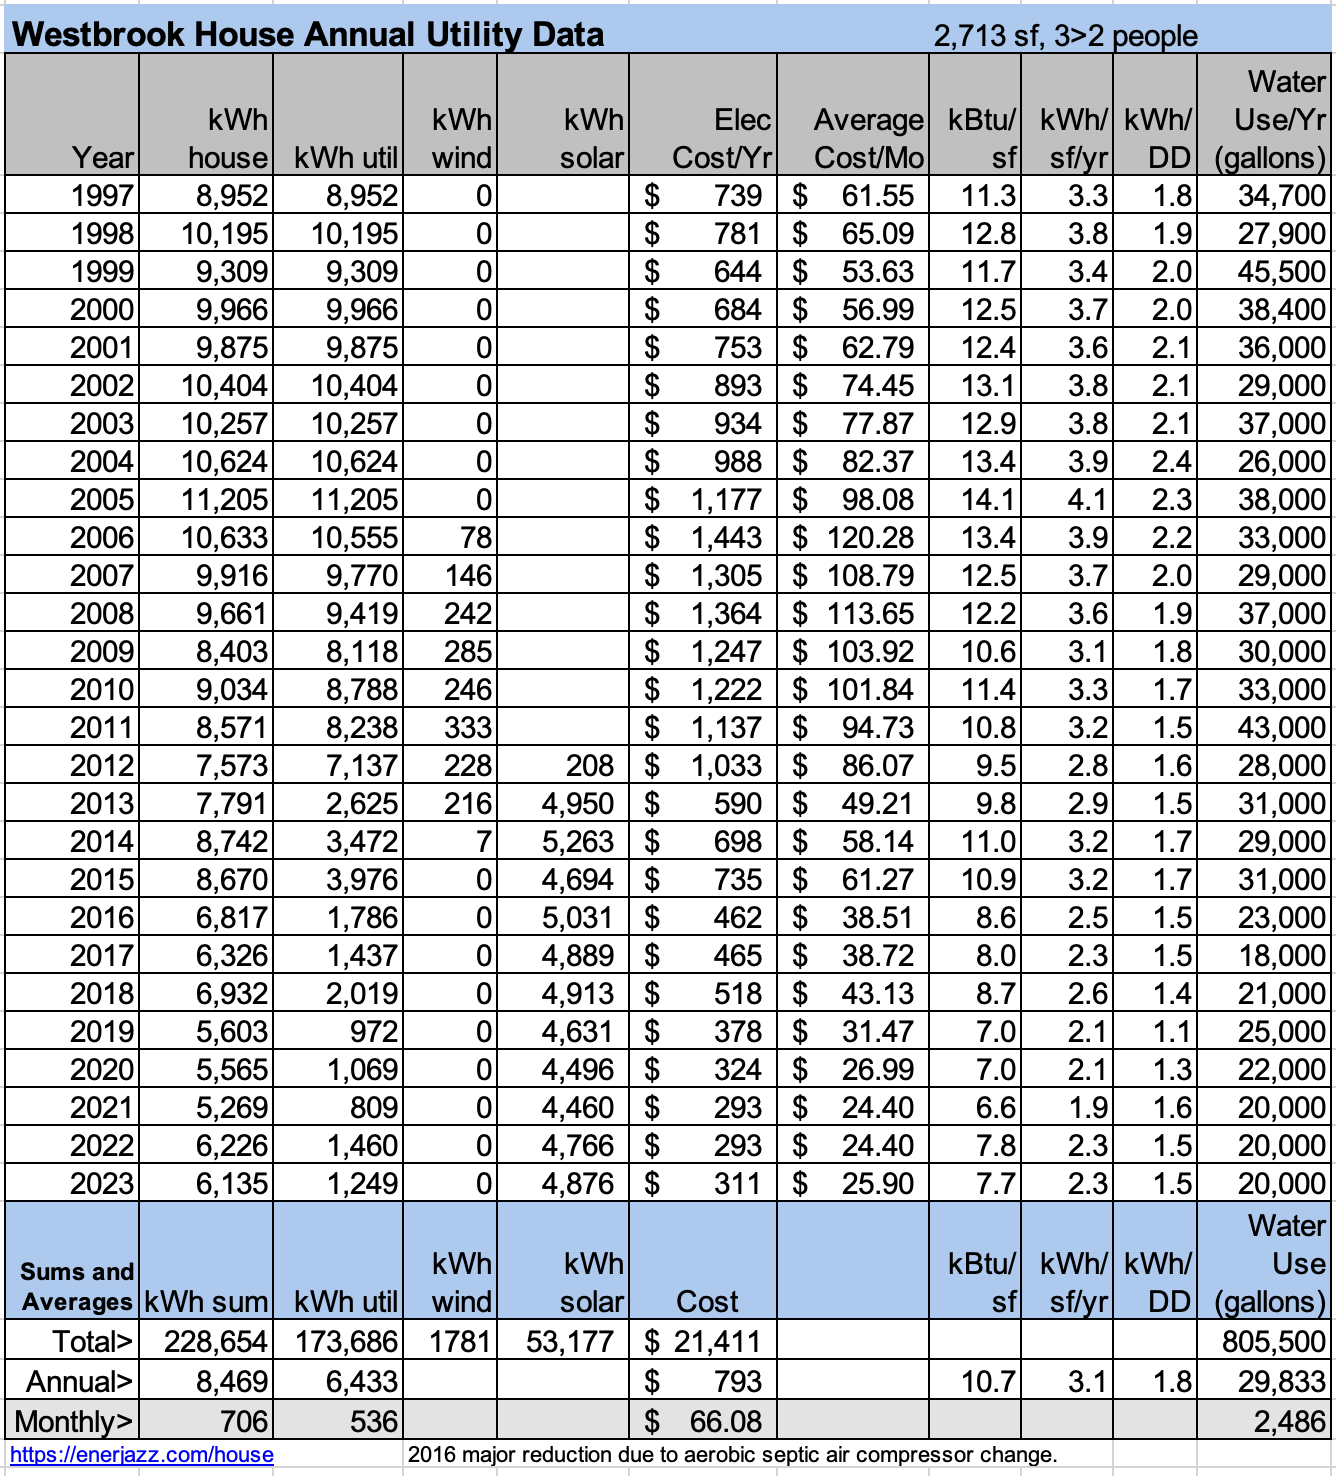
Westbrook Utility Data

Energy Use Trend

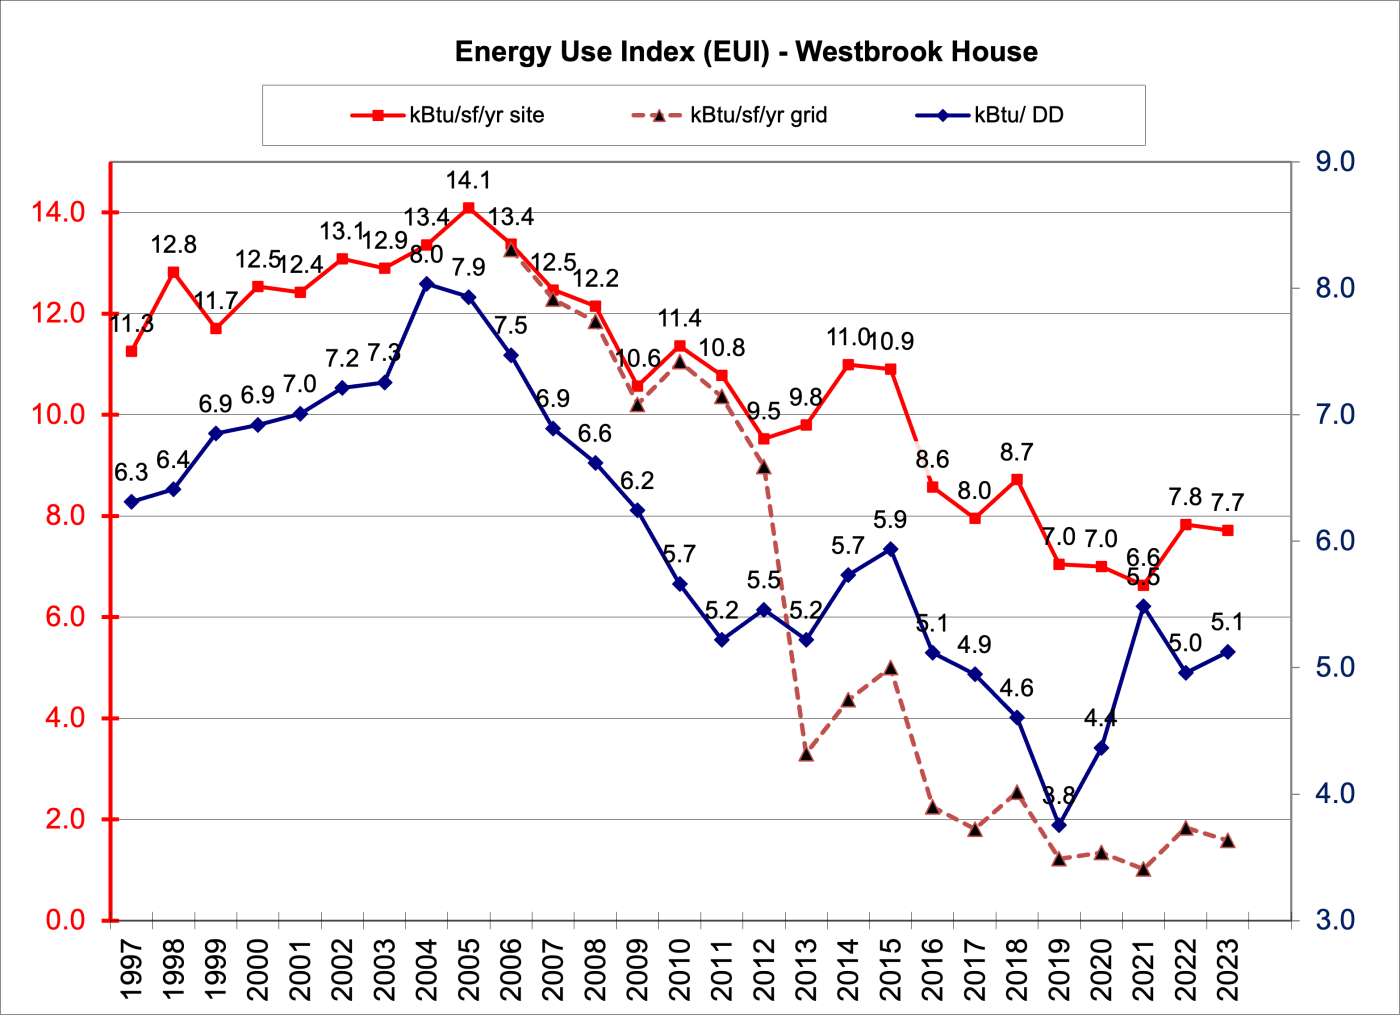
The house was efficient from the start. The red line is the EUI (kBTU/sf/yr). The dashed red line shows our net EUI from the grid. The blue line is energy use divided by degree days, which normalizes for weather conditions.

The peak energy use was when our daughter was in her teenage years and many of our appliances were aging. That peak year coincided with a small leak in our air-conditioner coil which degraded the performance of the unit. Tracking data helped me note the performance change and find the cause. As we began to upgrade the TV, computers, the refrigerator, and more appliances the internal energy use dropped. Then our daughter went off to college and it fell further. She lived at home for a bit after graduation giving us one final bump up before it begin dropping again. Midway through 2016 we replaced our high energy use aerobic septic aerator with a much more efficient model. In 2019 we upgraded our ground source heat pump (GSHP). 

Westbrook Energy EUI Trend

Water Use

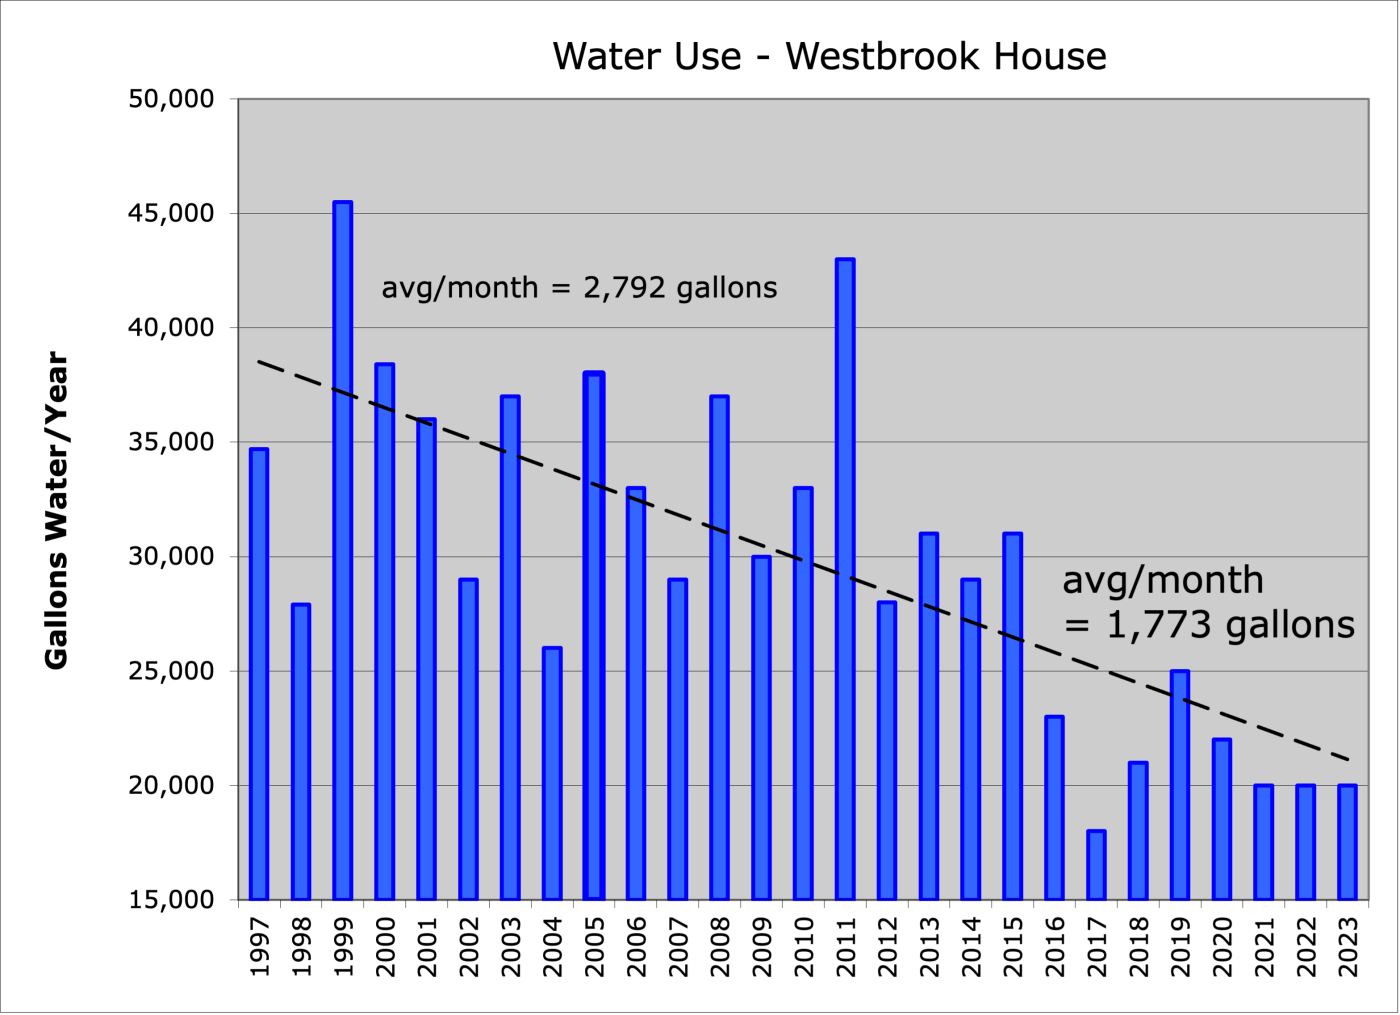
We use rainwater harvesting from our roof into two 1,600 gallon tanks placed at two corners of the house. We use rainwater for all outdoor uses - gardening, refilling the decorative pond, and minimal irrigation. We use municipal water for all indoor uses. Thanks to efficient plumbing fixtures we only use a fraction of the  amount of water of a typical home in our region. In 2009 Paul was named a the first Water Genius Award Winner by the North Texas Municipal Water District. Our water use is far less than the area average of 12,000 gallons/month. 

Solar Photovoltaic (PV)